AbstractThe debugger backend is a lower-level language subsystem enabling to control and inspect a program's execution (debuggee), while the frontend is a higher-level API for backend functionality aiming to support debugger user-interfaces. Existing debugger backends allow retrieve aggregate contents, but are language technology dependent, limiting the chances for producing debugger user-interfaces for other types of languages. For instance, it is common to use reserved type identifiers, like pointer, class, void and enumerated, restricting applicability to languages with no equivalent types. Moreover, in all known backends the aggregate nature of a value is implied by its type, requiring the debugger user-interface developer interpret it according to the language. For example, in Java Debugger Interface an object reference is always assumed to be an aggregate, while in GDB Internals gaining the contents of a memory address requires interpret the pointer type. We resolve such issues by implementing a backend component relying on encoding of aggregates in a language-agnostic way, with no explicit or implicit type information. Our backend supports incremental retrieval of contents, reducing the performance overhead observed in other libraries, like MS Visual Studio Debugger Visualizer Library, serializing entire objects. Our method has been implemented in the backend of the Delta language Debug Architecture (DDA), deployed by the Disco command-line debugger and the Zen graphical debugger, publicly available (details at the end). 1 INTRODUCTIONThe development of a debugger entails primarily three key components (see Figure 1): (a) the debugger backend being usually language or platform dependent; (b) the debugger frontend, being in most cases tied to a specific backend; and (c) the debugger user interface that has to deploy a specific frontend.
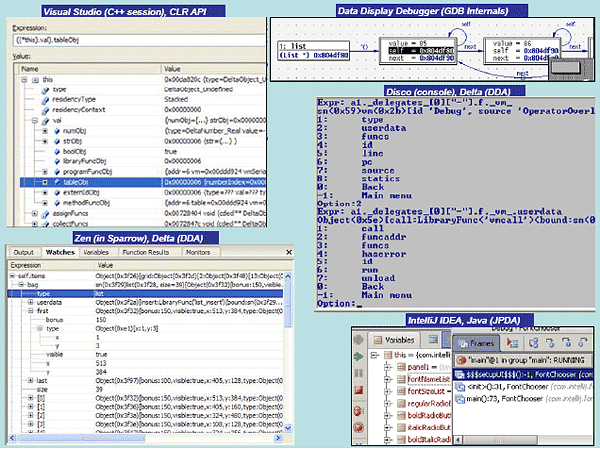
Figure 1: Key components involved in debugger development. The development style of the backend heavily depends on the target platforms, as well as the languages aimed to be supported. For example, if the debugged programs are compiled in machine code, specific operating system facilities are needed to control execution and to trace system-level events, as done in GDB [GNU07]. Additionally, the format of symbolic debugging information, inserted during code generation by the language compilers, must be known since it is read and analyzed before execution, or even during execution when a lazy approach for symbol loading is implemented (planned for the next version of GDB). On the other hand, for languages compiled to byte code the backend is typically built as a subsystem using intrinsic features of the virtual machine. The latter is usually opaque to language users and is implemented in native code to avoid circular interference, as with the Java TI [Sun05] and the CLR debugging API [Microsoft07-2].
Figure 2: Browsing support for aggregate values in different debuggers. In all backends, various methods are offered to query the contents of variables and program memory, in ways depending on the language semantics (e.g., in Java or CLR no memory inspection is supported as with C++). Content retrieval for aggregate variables and interactive browsing is a valuable user-interface feature of most existing debuggers (see Figure 2), enabling programmers rigorously inspect and analyze the current program state. Such browsing facilities may support typical tree views, or even object graphs, the latter capable of revealing recursive associations. Identification of the ProblemOur technical focus is on implementation methods enabling debugger backends deliver functionality in ways hiding language details. Such a potential genericity will inherently turn frontends to language-independent modules, since the latter are no more than remote interfaces to the backend services. In this context, while reviewing the core debugger architecture of many languages we observed that, in all cases, the information describing the returned value of queried expressions is language dependent, since it explicitly involves type information. Effectively, the debugger user-interface developer is obliged to implement the browsing logic according to the type information obtained for aggregate variables. The latter disables the implementation of a common language-agnostic component to browse aggregate values for debugger user-interfaces. We present a method to effectively overcome this barrier. Currently, we support this method in the debug architecture of the Delta language [Savidis08] - Delta Debug Architecture (DDA). The latter has been deployed in the development of two debugger user-interfaces, a command-line debugger (Disco), and graphical one (Zen) embedded in the Sparrow IDE of the Delta language. Although our test-case is a dynamically-typed language, as we also demonstrate with specific examples for describing C++ STL container values, our method is pretty generic. Overview of ContributionIn our approach, we entirely avoid type descriptors in the value information for aggregate variables. Instead, we introduce indexing strings (expressions) for fields, to be deployed as they are by the debugger user-interface when querying field contents. Such a process may be recursively applied in case the returned value of a queried field is tagged as aggregate too. The responsibility to generate and interpret field indexing strings is entirely on the backend in a way fully transparent to the frontend. Practically, the content of indexing strings will reflect being language-specific lexical and syntactic characteristics. However, the frontend is never required to interpret such contents. It merely uses the indexing strings to post further field queries. We present a quick example related to the C language to outline our method. Consider the C type struct List { char val[64]; List* next; } and a respective program variable x where x.val="hello", x.next points to a List where x.next->val="world" and x->next->next = NULL. In the request of "x" expression via the debugger frontend, the debugger backend will return the following value information:
n the previous list, the way the content of the various indexing strings is produced is a responsibility of the debugger backend and is clearly dependent on the particular language semantics. For instance, a C-language backend will adopt a memory address as an absolute reference to an aggregate object, while a Java backend may use an object reference string appropriate for the JVM. Based on this information, the debugger user interface can produce an appropriate interactive display view as shown under Figure 3, part 1 (top left). Notice that for all fields the debugger user-interface uses the display string returned as part of the value information.
Figure 3: Example of debugger data inspection with incremental query on selected fields. Now, let's assume the user chooses to view the content of "val" field. The user-interface needs only concatenate the "x" of the original expression with the respective indexing string of the field selected for inspection , being "->val" in our example, and post an inquiry for evaluation of the "x->val" expression. In this case, the debugger backend will return the following value information:
Through such information the debugger user-interface may further expand the field display to incorporate the received value as shown in Figure 3, part 2 (bottom left). It should be noted that field type information is visible to the user only because it happens to be embedded in the received value content string "char[64]: 'hello'". Following similar steps, the "next" field is also expanded, as shown in Figure 3, part 3 (top right), being received as an aggregate value with explicit field access information, like the previously queried "x" expression. Finally, to obtain the two fields of x->next, the concatenation with the respective field indexing strings will produce "x->next->val" and "x->next->next", thus resulting in the fully expanded display of the entire aggregate object x as shown in Figure 3, part 4 (bottom right). This example provides an overview of the way our expression query method allows debugger user-interfaces to access individual fields of aggregate objects and to even display type information without introducing in the backend module functions involving type-specific parameters. In summary, the novel features of our method for obtaining aggregate values are the following:
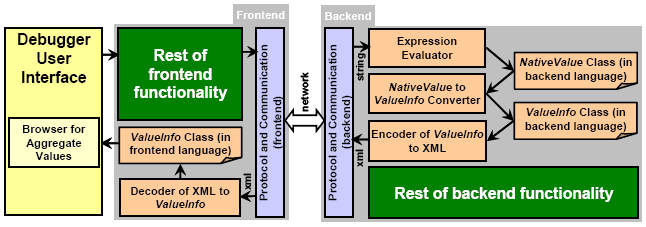
2 RELATED WORKWe continue by studying some of the major debugger backends currently deployed in the development of most popular source-level debuggers. In particular, we focus on the APIs offered by the corresponding frontends, showing that they all introduce type-dependent information, effectively rendering the frontend as language dependent. GDB Internals, Types [Gnu07] The Internals library of GDB is an interface to the GNU GDB debugger, not a typical frontend as such, but a sort of a control API (via libgdb) over the basic GDB debugger that must be running. It aims to support graphical user-interfaces. The API part relating to variable content information is the Types section, directly revealing language-specific types like builtin_type_void and builtin_type_char, meaning the graphical debugger is obliged to interpret value information in compliance to such language-dependent type tags. Java Platform Debug Architecture (PDA), Debug Interface[Sun05] The JPDA JDI is a debugger frontend in Java providing information useful for debuggers and similar systems (like profilers) which need access to the running state of a (usually remote) Java virtual machine. The API being in Java allows tool developers to easily create Java debugger applications running portably across various platforms. The JDI API defines classes of outgoing requests (com.sun.jdi.request package) and incoming events (com.sun.jdi.event package) communicated to / from the backend (Java Technology Interface), together with classes regarding the value of inspected variables, derived from (implementing super-interface) Value. Examples of such classes modeling the content of values are CharType / CharValue, ArrayType / ArrayReference, and ClassType / ClassObjectReference. It is evident that such classes, which must be deployed by the debugger user-interface developer, are strongly tied to the Java language. CLR Debugging Architecture, Debugging API [Microsoft07-1, Microsoft07-2] The Debugging Architecture (DA) of the Common Language Runtime (CLR) allows debugging in a uniform manner executables which encompass both managed and unmanaged code (i.e. mixing CLR byte code and native code). This is a powerful feature towards mixed-language debugging that is not supported by the JPDA where native code is opaque during debugging of Java code (there is no way in JPDA to trace into native code). The CLR debugging API, amongst a plethora of other features, provides methods to get the value of an argument or local variable that is stored in a specified register of a retrieved native stack frame instance. The value type is gained by calling the ICorDebugValue::GetType method returning a CorElementType value tested against type tags like ELEMENT_TYPE_STRING, ELEMENT_TYPE_CLASS and ELEMENT_TYPE_GENERICINST. An important difference when comparing to similar Java API is that the value type for CLR is actually a unified API covering the C#, C and C++ languages altogether. Nevertheless, the API still remains language-dependent, despite the fact it unifies three languages instead of one. Visual Studio™ Debugger Visualizer Library[Nonnenberg05] Not a debugger frontend as such, it generally falls in the category of add-ons enabling to extend or enrich specific debugging facilities, in particular the data visualization support. In this library, all data to be visualized must be serialized to System.IO.Streams to be transported between the debuggee and the visualization code residing in the debugger user-interface. To simplify this, Microsoft.VisualStudio.DebuggerVisualizers.dll provides a class called VisualizerObjectSource that does the most basic type of serialization required by serializing the entire object and making it easy to extract it on the debugger user-interface side, for objects having the Serializable attribute. In [Nonnenberg05] it is acknowledged that performance may suffer if large classes are visualized using this method, so it is recommended to develop some sort of on-demand communication mechanism beyond the default monolithic implementation. For example, a List visualizer might only transfer the elements initially in view; once the user scrolls, the visualizer could request the data necessary to draw the new view. We put emphasis on this remark, since our method already supports incremental on-demand content delivery for aggregate objects. Lua Debugger Interface [Ierusalimschy03-2] Lua [Ierusalimschy03-1] does not offer a debugger frontend as such, but reveals a lower-level backend C API implemented in native code as part of the Lua Virtual Machine. In this sense, the debugger interface assumes the debugger user-interface developer to deploy directly the core Lua API (embedding API) in order to access the stack and to examine variable state (content). Overall, compared to previous methods, the Lua Debugger Interface is the most primitive API, and also the most language-specific for debugger user-interface development. DBGP Common Debugger Protocol [Caraveo07] DBGP is a simple frontend protocol to use with language tools and engines for the purpose of debugging applications. An interesting feature of DBGP is that it supports incremental retrieval of aggregate object contents, relying on string identifiers for field names that the debugger user-interface should concatenate (all the way to the root aggregate object) so as to query a field (see Section 7.11 of the protocol definition). However, the protocol itself still introduces data types, which, while aimed to be generic enough, they can't be in real practice. More specifically, section 7.12 of the protocol presents common data types together with a way of mapping native (debuggee language) types to generic frontend types. Such type information should be used by the debugger user interface to decide the value query policy. In particular, hash is type tag for dictionaries, supporting only string keys. The latter is inadequate for even trivial cases of the C++ STL std::map where keys other than string may be commonly defined. Additionally, there is a resource type tag, experimentally introduced to address types not covered by the standard types of the protocol. This type tag is very problematic, since, at the user-interface level it practically implies a sort of 'no further inspection possible' dead-end. Even for scripting languages, for which the protocol was likely originally inspired, such a restriction is very crude. For example, most scripting languages support native pointers as external objects, whose data structure and operations (methods) are defined in C or C++ code. In such cases, there is no way for the developer of native libraries to allow scripting language users inspect in detail the native objects. As we will show, our frontend method puts no restriction as to the type of objects for which the backend allows detailed inspection. Next we continue elaborating on the software architecture putting emphasis on the component structure to support language-independent aggregate object inspection. 3 OVERALL SOFTWARE ARCHITECTUREWe discuss the software architecture details, in particular the way expression evaluation is managed at the debugger backend and frontend sides. At the macroscopic level, the architecture adopts the typical separation among the backend and frontend components via remote communication. In this context, we put no particular requirements on the way these two basic components are implemented and the specific services they provide. Practically, our approach can be easily implemented as an extension on existing debugger engines with a relatively small effort, independently of their implementation language and software architecture. Our architecture is outlined under Figure 4. Its is evident that the changes introduced on typical debug architectures merely relate to the way an expression evaluation result is converted from a native value object to a language-neutral value-information object (see right part of Figure 4, control flow starting from 'Expression Evaluator').
Figure 4: Overview of the debugger architecture to support language-agnostic expression evaluation and incremental browsing for aggregate values. In this process, two key classes are involved, NativeValue and ValueInfo. Naturally, for backend languages with no support of classes other user-defined structured data types can be used to model value content and value information (like structures, tuples, records, etc.). Objects of NativeValue class are practically metadata for native values enriching the latter with type information. This way, it is possible to write code which extracts the contents of an aggregate native value from a NativeValue object. The NativeValue class is intrinsic to the debugger backend, and in the language the backend is also implemented. Currently, as discussed in the 'Related Work' section, most known backends or frontends already encompass a data type with role similar to NativeValue class, although they tend to externalize such a type to the debugger frontend. For example, in CLR this role is covered by the Metadata API together with the reflection API (debugger APIs at backend side), while, under JDI, objects of class implementing Value super-interface (API at frontend side) may be examined via reflection. Also, the step involving translation of a native value to respective metadata is implemented in most debugger engines, since they make such metadata available to the debugger frontend.
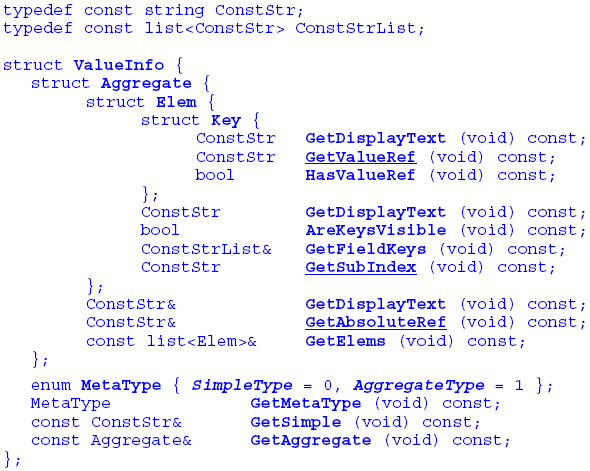
Figure 5: Outline of the ValueInfo C++ class (as a struct to avoid access qualifiers) for the debugger frontend and backend of the Delta language; constructors, destructors, operator methods, and member fields, have been all stripped-off for clarity. In conclusion, as a first step, we propose to encapsulate (hide) any value metadata at the debugger backend side. The ValueInfo class is a special form of metadata whose objects carry information regarding the value content for display purposes only, having no type related elements. In this sense, the ValueInfo object of a native value is an external language-independent representation. As an example, consider the numeric value 10. On the one hand, as a NativeValue object it carries a type tag corresponding to numeric data types, together with the native representation of the numeric value 10. On the other hand, its respective ValueInfo object carries merely a meta-tag identifying it is a simple value and the string value "10" as its displayable content. The difference amongst the two classes is fundamental. While from a NativeValue object the native value can be always obtained, from a ValueInfo object it cannot since type information is missing. Clearly, converting from NativeValue to ValueInfo is implemented in a straightforward manner by dispatching on the NativeValue type tag, the process applied recursively for aggregates. In Figure 5, our implementation of the ValueInfo class in C++ is outlined for the Delta debugger engine, currently shared by the backend and frontend as they are both implemented in the C++ language. Following Figure 5, ValueInfo merely distinguishes two fundamental meta-types for values: AggregateType and SimpleType. Simple values need only carry the display content that is stored in a string (see GetSimple() method). Apparently, for Aggregate values more information is included: List of elements taken via GetElems() method, with information per element modeled through the Elem class Optional display text for the entire aggregate object taken via the GetDisplayText() method, such as "List(): 0x3fdcc80ef" of our early example in Figure 3 Reference string taken via the GetAbsoluteRef() method, uniquely identifying the entire aggregate object such as "0x3fdcc80ef" of our early example in Figure 3, enabling easily identify recursive references As explained earlier, what is actually put inside display or reference strings is a responsibility of the backend. In our example, it happens to be a pointer address in hexadecimal format, while as we discuss latter, the Delta debugger backend produces reference strings like "_2object(0x13)" or "_2externid(0x14)". Whether such references are displayed to the user is a matter of the debugger user interface. For instance, in a DDD [DDD08] style data visualizer it may be more appropriate to show such reference strings, while in a typical tree view browser likely not. Returning to our architecture of Figure 4, as shown, the produced ValueInfo object is encoded in XML and communicated through the network to the debugger frontend. Then, it is decoded to the original ValueInfo object, however, ValueInfo class now defined in the frontend programming language. Apparently, the ValueInfo class may be reused by the frontend in case it is implemented in the same language as with the backend. The retrieved ValueInfo object is then used by the component facilitating interactive browsing of aggregate values. This component may post further expression evaluation requests for field expansion, as briefly explained in our introductory example. The details of this process are discussed under Section 5 'FRONTEND AND UI: DECODING AND BROWSING'. Next we continue with the details of converting native values to value information, discussing the design rationale regarding: structure, syntax, multiple encoding formats, and value conversion examples for objects in different languages. 4 BACKEND: CONVERTING AND ENCORDINGThe choice of the ValueInfo structure to carry display information was the result of an in depth study regarding the type information required by debugger user-interfaces so as to support effective inspection of aggregate variables. We have examined scenarios with varying requirements such as:
Alternative field access policies:
Various object models:
The need for such an exhaustive analysis with diverse scenarios was prominent, since, the elimination of type information at the debugger frontend side requires guarantee that type information won't be necessary whatsoever. The text encoding syntax for value information is provided under Figure 6. We continue with a few examples demonstrating the expressive power of the encoding method for aggregate objects in C++ (typed class-based) and Delta (dynamic object-based).
Figure 6: Grammar in EBNFfor encoding ValueInfo to text. Encoding Examples for Aggregate ValuesC++ STL std::list Since it is a container supporting sequential access, we chose an encoding style by enumerating elements through successive numeric indices that the backend can interpret, even though such random access is not provided by the actual class (i.e. can't get independently a list element by such indexing). The display text of every element provides information regarding its position in the list, while the display text of the list object displays information regarding the number of elements and the element type (template parameter) of the list. For example, for a list<int> with elements 23,56,98 an encoding could be the following:
The strings at the right of the index keyword, e.g. ".getbyorder(0)", are actually the indices to be internally used by debugger user-interface when querying the value of individual fields. The displayable part of the keys, when listing all fields in the user-interface, are provided by the strings at the right of the display keyword, e.g. "(0)". To query individual fields, every index entry should be concatenated with the aggregate's absolute reference string next to absref to form the expression string for field inquiry. For example, "(*(list<int>*)0xfe129409).getbyorder(0)" string is the entire expression to query the first field. When for a particular element its key is defined as hidden it means the debugger user-interface should never display the internal key explicitly to the user. The indexing method implied by the string content of the index entry is something to be supported by the expression evaluator, not actually related to the methods offered in the language for manipulating aggregate types. For example, "getbyorder(0)" need not be a method of the list class, but a pseudo method handled by the expression evaluator at the debugger backend side. In a similar way, pseudo attributes may also be introduced. C++ STL std::map It is a single-key dictionary container supporting aggregate keys. Stored elements are aggregates as pairs of the key and a respective stored value. In C++ debuggers, like Visual Studio, it is supported to enumerate (according to an implementation-dependent ordering) all elements, enabling browse the pair contents (via first and second fields). Lets consider a map of strings keys and integer values, with the elements <"hello":9> and <"world":11>. We provide below the encoding for the map aggregate itself, and the two aggregate elements.
Because an STL map encompasses the key value in the element structure, access to key contents is straightforward through index .first, whether the key is aggregate or simple. In other words, if the field key is also a reserved normal field, like first, it is enumerated with the rest of the fields during encoding, as with the example above. However, in some cases dictionary types may be an integral part of the language, rather than part of accompanying libraries, while the storage area of key values is opaque to programmers. In this case, for aggregate keys it is necessary to provide extra reference facilities so as to support expandability by the user. The next example is about this scenario. Delta Object Delta is an untyped object-based language (i.e. has no notion of a class), where objects are created by replication (usually the very first objects in such a process produced explicitly by initializing fields, not by cloning, are commonly referred as prototypes). The main object element in the Delta language is a single-key dictionary, allowing keys of any value (not only strings, but objects or methods may play the role of keys as well), while supporting runtime inheritance associations among distinct objects to form either delegation webs or subobject trees [Savidis08]. Practically, as with all languages, an object is an associative container. When during debugging an expression evaluates to an object having aggregate keys, like an object or a method, it is imperative to allow the user expand the contents of the aggregate keys as well. We show how our value information grammar enables to inject such information within value encoding. Let's consider an object A having three fields with the following keys and respective values: string key "x" for value number 10, numeric key 0 for value a program function f, and an object key B for value being another object C. The text encoding in our grammar is provided below.
The key point in the previous value encoding is the presence at the third element of a keyref string, e.g., "_2object_(0x17)". This entry implies that the respective key is aggregate and may be expanded as well, while the keyref string content is the precise object-reference expression string that can be used to actually gain the key value. It should be noted that the reference string must be used as it is by the debugger user-interface to query they key contents, i.e. no extra concatenation with the aggregate's reference string is needed. C++ derived objects The debug information provided for objects pertaining to classes involved in an inheritance scheme may vary per language, while it is strongly dependent on the language inheritance semantics (e.g., single versus multiple inheritance, explicit versus implicit abstract classes or interfaces, etc.). What is common, however, is to allow inspect the base parts of an object, i.e. those donated by its base classes, and usually the virtual table for all late bound methods. In this context, let's consider an object of class C derived from A and B superclasses, by refining virtual functions A::f and B::g, and encompassing two fields with identifiers x and y. Most debugger backends allow inspection of the locals, the base objects, and the virtual table. Usually, base objects are listed before local members, with an appropriate display string encompassing the class name, such as "<A>", "[A]" or "(A)", to make them distinguishable from the rest of normal members. A similar technique is applied for the virtual table, while the number of entries could be also concatenated as a suffix to brief the total number of virtual functions, e.g., "[vtable](2)" in our example. Once the backend supports extraction of such information, the encoding through our method is straightforward, as shown below.
As indicated, all artificial fields introduced by the backend are made invisible to the user, disabling explicit reference. The reason that such indexing strings are hidden is mainly implementation dependent, since they rely on intrinsic undocumented pseudo methods that may be subject to change in future backend versions. Native objects in scripting languages (example in Delta) Scripting languages, interpreted or compiled, provide an execution engine, interpreter or virtual machine, and a basic runtime library, both implemented in a host language (native code). User-defined libraries in native code are normally supported. In this context, it is very common for library functions to produce objects whose class is defined by native code, meaning class information may be opaque to the scripting engine, and inherently to the debugger backend. Even when the native code is implemented in languages with a comprehensive runtime reflection API, like Java or C#, the automatic inspection of native objects may be inappropriate. In particular, for self-checking reasons, some scripting libraries may wrap native objects with special-purpose objects carrying extra meta-information such as: serial number, creation timestamp, native source file name and line in which instantiated, etc. Such wrapping is library-dependent and cannot be known a priori to the scripting language. Consequently, scripting language developers must provide a standard infrastructure so that library developers may extend inspection to appropriately apply on native objects.
Figure 7: Inspection wrappers on native library objects in the Delta debugger backend to support queries for native object fields using string indices. The way we solved this problem in the debugger backend of the Delta language is to offer a standard inspection wrapper for native objects (see Figure 7), which, amongst others, allows library developers to hook functions: (a) enumerating the string keys of visible fields; and (b) responding to field inquiries using respective string keys. This way, the backend is capable to produce a ValueInfo for native objects, while the expression evaluator can query field contents of native objects using merely string keys. We provide below an example of the text encoding for a list aggregate value with three elements; list is a native library object in the Delta language standard library, i.e. it is not a built-in type as in other dynamic languages.
As observed, in contrast to the previous cases where hidden indices where chosen for artificial fields, the extra fields offered by the list library object are now visible to the user. The same holds true for the numeric indices supported per element. Hence, it is possible to index individual elements independently like "my_list[0]", besides viewing individual fields when browsing the respective container. In typed scripting languages, the problem of enabling inspection of native objects by the debugger backend may be resolved through an infrastructure enabling to introduce native classes while turning them automatically exportable scripting language (e.g., like in [BoostPython08]). Internal ArchitectureThe internal software architecture for expression evaluation, and conversion from language-specific native values to language-independent value information, is illustrated under Figure 8.
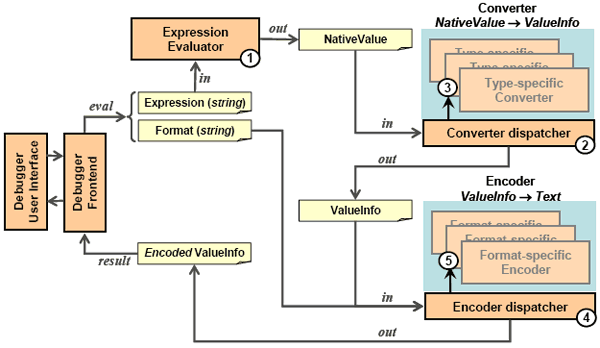
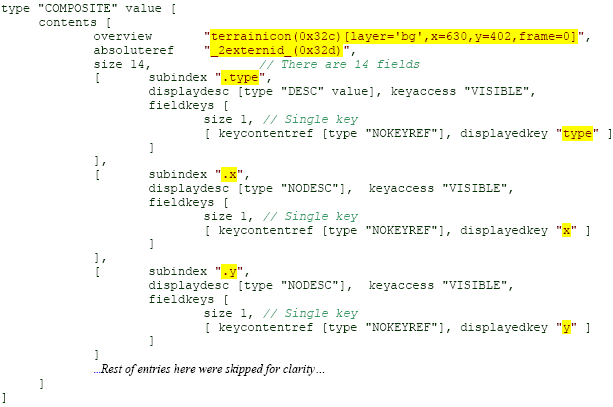
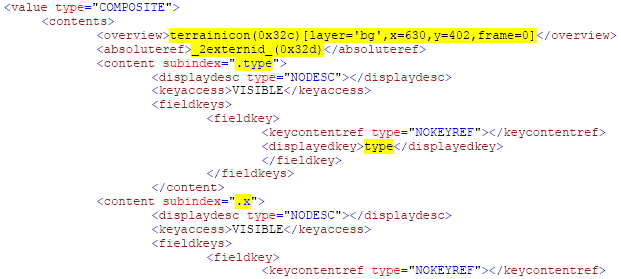
Figure 8: From expression evaluation strings to formatted value information. Following Figure 8, the input coming from the debugger frontend is typically supplied by the user through the debugger user-interface and encompasses the actual expression string. Additionally, a string identifier of the desirable encoding format regarding for returned value information (e.g., in XML) is supplied by the debugger frontend; we explain the format latter in the next Section. The expression evaluator (step 1) parses the input expression and outputs the corresponding native value. Then (steps 2 and 3), conversion to value information is handled by dispatching on the actual native value type, invoking the appropriate type-specific converter. Following (steps 4 and 5), the resulting value information is encoded according to the requested format, by internally dispatching to the format-specific encoder. Eventually, the resulting value information in its encoded form is sent back to the frontend via network communication. Value Information Encoding FormatsThe debugger backend may support encoding of value information in different formats. While one possible universal format could be textual encoding in XML, in some cases, other formats may be deployed such as a structured configuration language, or even binary encoding. For example, in case of a Java frontend and backend we may wish to eliminate the overhead of converting from Java to text and then back to Java by enabling value information serialization to be a legitimate encoding policy. Overall, the only requirement for encoding is that either the encoding syntax is well documented so that the frontend can perform the decoding process, or that the necessary decoders are simply made available as part of the frontend library. Additionally, the frontend should enable debugger user-interfaces query the supported encoding formats. We show the two formats supported for encoding value information in the Delta debugger backend: (i) RC, the resource format of the Delta standard library (see Figure 9); and (ii) XML (see Figure 10).
Figure9 : Encoding of value information, for a native library object, in the Delta RC format (like tag-less XML), following the grammar of Figure 6; actual value contents are shown highlighted.
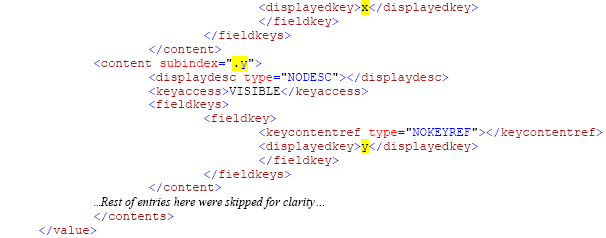
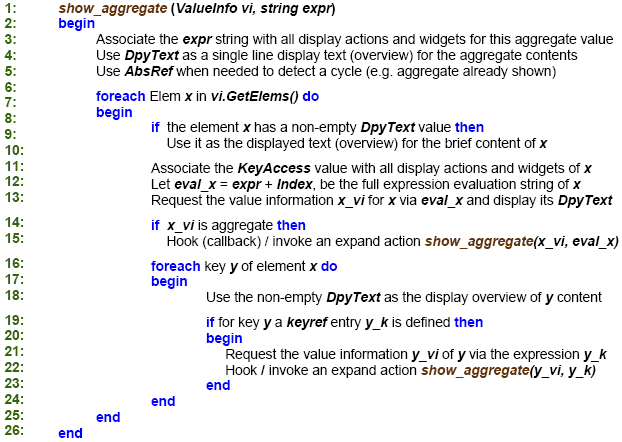
Figure 10: Encoding of the value information from Figure 9 in XML format; actual value contents are shown highlighted. 5 FRONTEND AND UI: DECODING AND BROWSINGFor convenience, the debugger frontend may provide methods to decode value information and store it locally in some intrinsic data structures. The latter is optional, since through our method the encoding method may be standardized and documented. For instance, in case of XML encoding, any XML parser may be used to extract value information contents. Regardless of the decoding responsibility, the debugger user interface should allow users interactively browse into the aggregate value contents, while likely posting extra expression evaluation requests to the backend. In this context, we detail in Figure 11 the logic for presenting an aggregate value, irrespective of the display method (e.g., tree view as in Visual Studio, data object graph as in DDD, or menu-based display as in Disco debugger). As discussed earlier, a value information instance encompasses information only on how to extract (query or evaluate) the various fields of an aggregate object using respective indexing strings, without encompassing the actual values. The latter are to be gained with successive evaluation inquiries using the original aggregate's expression together with the field index. The latter is also apparent in the show_aggregate function of Figure 11. In graphical debugger user interfaces we would probably prefer to display field keys together with their value. For this purpose, at line 13, an extra evaluation inquiry is made per element using the fully qualified expression string of the element produced at line 12, by concatenating the aggregate's expression string with the element's respective index. The returned value information is used to extract the element's value DpyText (line 13), to be usually shown next to the element's displayed key. Additionally, for all aggregate field values (test at line 15) we facilitate further expansion of their contents by extra calls to show_aggregate (at line 16). Such calls may be hooked as typical user interface callbacks, invoked during interaction when the user clicks on the respective element's inspection widget (i.e. expansion on demand, or incremental expansion), or may be called directly, i.e. recursively, when exhaustive expansion of aggregate contents is desired. The logic to display the element's keys starts at line 16. Since we support multiple keys per element we assume their display is a concatenation of the display stringsper key. For example, for an element indexed with three keys, with respective display strings "a", "10", and "\"hello\"", we use the single displayed key value "a, 10, \"hello\"". As explained earlier, our method also addresses cases of aggregate key values. For the latter, in a way similar to aggregate fields, we may either hook, or directly apply, an invocation to show_aggregate (at line 22) enabling users further expand and inspect the contents of the aggregate key.
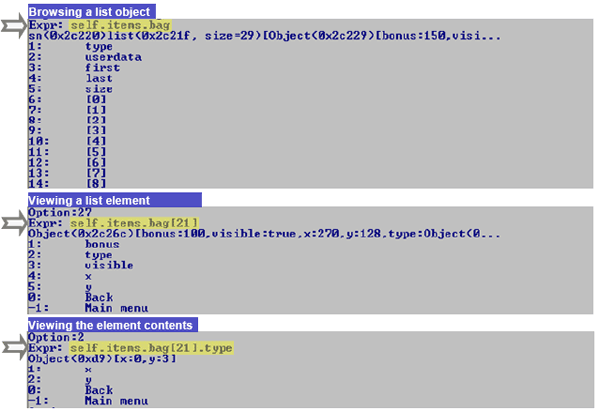
Figure 11: Logic to retrieve and present aggregate values using value information, with the necessary user interface hooks for further inspection by expanding fields. 6 APPLICATION OF THE METHODAs mentioned earlier, we have fully implemented our method in the context of the debugger backend for the Delta language [Savidis08], and inherently within the respective debugger frontend. The latter is a typical client API communicating with the debugger backend over the network. In this context, using this infrastructure, we have developed two separate debuggers for the Delta language: (a) a standalone command-line debugger, named Disco, and; (b) a graphical debugger named Zen, embedded in the Integrated Development Environment (IDE) of the Delta language named Sparrow. To our knowledge, the Disco debugger is the first command-line debugger to facilitate browsing into the contents of aggregate objects. Disco Command Line DebuggerThe Disco command-line debugger allows incrementally browse into the contents of aggregate objects by providing a sequence of nested modal menus. At every point in time only a single aggregate object may be inspected through such a menu, displaying the string keys of its fields, while enabling the user to either return back to inspecting the outer aggregate object (container) or escape to the main menu (Back and Main menu options respectively shown at Figure 12).
Figure 12: Snapshots showing browsing in a native list object using the Disco Delta debugger. When the value information of an aggregate object is received, the browsing menu is automatically assembled with N+2 options, N being the number of field entries of the aggregate object. The N menu items are reserved for the aggregate fields, while the necessary actions are hooked at every menu item to further request the contents of the particular corresponding field. For convenience, we have eventually chosen to use numeric indices as the selection codes for menu items corresponding to fields, as opposed to using directly the field keys. Initially, we adopted the latter approach. However, our tests indicated that it is slower for users to type the key expressions compared to entering natural numbers. The last two menu options are for returning to the previous inspection menu, i.e., the aggregate containing the currently viewed aggregate (option 0), and to the main debugger menu (option -1). At any point, the reference expression of the inspected aggregate is shown (see Expr: message at Figure 12) to enable users keep track within nested aggregates. It should be noted that current Disco is the only known command-line debugger supporting such browsing facilities for aggregate objects.
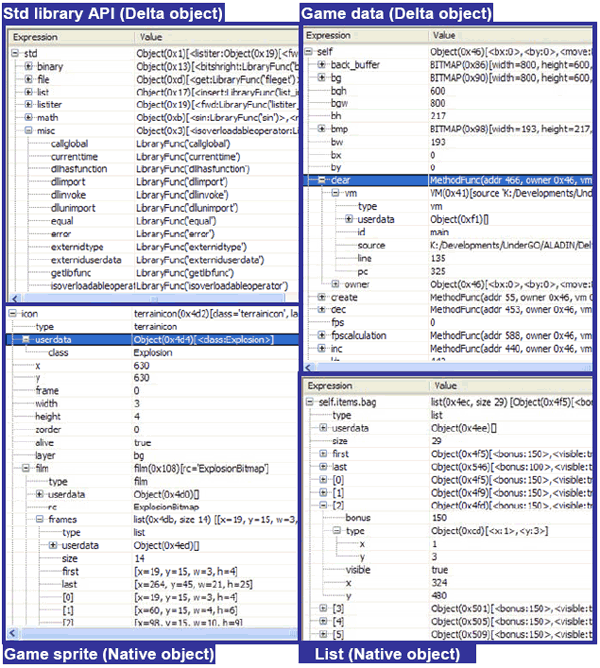
Figure 13: Snapshots showing browsing of different types of aggregate objects (language objects as well as native - external - objects) using the Zen Delta debugger. Zen Graphical DebuggerIn this graphical debugger, embedded in the Sparrow IDE of the Delta language, we have also implemented aggregate object browsing through the proposed method. Additionally, in the game development libraries of the Delta language, we have incorporated the inspection wrappers for native objects, as previously presented, to support debug queries for fields of native objects using normal string indices. As expected, the Zen debugger behaves a little a different than the Disco debugger for aggregate objects: (a) it creates tree view entries per aggregate object field; and (b) it queries every individual field, while setting as display content next to the field's key the received display text, and introducing an extra tree expansion widget (a cross) in case the field is also aggregate. Examples showing inspection of different types of values are shown under Figure 13: a standard library object (top left), a game sprite object (bottom left), a game data object (top right), and a native list object (bottom right). In particular, for the list object, it is interesting that for the debugger user-interface there is no difference among string indices and numeric indices. Additionally, the fact that all string indices of the list object are placed before numeric indices, and that in both cases the indices are sorted, is due to the logic we have introduced in the backend, when converting native values to value information. This indicates how ignorant the frontend is essentially made, and how the complexity of evaluation and field representation is shifted and entirely hidden in the backend through our method. 7 SUMMARY AND CONCLUSIONSWe have introduced an implementation method for debugger backends supporting language-independent browsing into aggregate object contents. Our method relies on the transformation of language-specific native values to language-independent value information. The latter carries all the necessary information to allow debugger user-interfaces display individual fields and post further evaluation requests for retrieval of individual fields that may be aggregate as well. The primary benefit of our technique is that the debugger user-interface component offering expression watches, or tree and graph object views, becomes language independent. Our method has been extensively tested in modeling a wide range of aggregate objects in varying languages, and is currently implemented by the debugger backend of the Delta language, deployed by the two interactive debuggers briefly discussed. As a closing remark, while reviewing numerous frontend interfaces of different languages, it became evident that the API parts being language-dependent concerned expression evaluation, since they tend to introduce language-specific value types. In this context, by eliminating this dependency, we consider our work a big step forward for building language-generic debugger user interfaces.REFERENCES[BoostBython08] 'Boost.Python', http://wiki.python.org/moin/boost.python and also from http://www.boost.org/doc/libs/1_39_0/libs/python/doc/index.html [Caraveo07] Shane Caraveo, Derick Rethans: 'DBGP - A common debugger protocol for languages and debugger UI communication', http://www.xdebug.org/docs-dbgp.php#data-types, 2007. [DDD08] Data Display Debugger. http://www.gnu.org/software/ddd/ [GNU07]. Free Software Foundation: 'GDB: The GNU Project Debugger'. GDB Internals. http://www.gnu.org/software/gdb/documentation/, 2007. [Ierusalimschy03-1] Romeo Ierusalimschy: 'Programming in Lua', Book available on line from http://www.lua.org/pil/, ISBN 85-903798-1-7, 2003. [Ierusalimschy03-2] Roberto Ierusalimschy, Luiz Henrique de Figueiredo, Waldemar Celes: 'Lua 5.0 Reference Manual', http://www.lua.org/manual/5.0/manual.html, 2003. [KDBG07] A Graphical Debugger Interface. http://www.kdbg.org/, 2007 [Microsoft07-1] Microsoft Corporation: 'CLR Debugging Architecture', http://msdn.microsoft.com/en-us/library/bb384548.aspx, 2007 [Microsoft07-2] Microsoft Corporation: 'Debugging in the .NET Framework', http://msdn.microsoft.com/en-us/library/bb384289.aspx, 2007 [Nonnenberg05] Scott Nonnenberg: 'Creating a Debugger Visualizer Using VS 2005 Beta'. http://msdn.microsoft.com/en-us/library/ms379596.aspx, 2005 [Savidis08] Anthony Savidis: 'An enhanced form of dynamic untyped object-based inheritance', in Journal of Object Technology (JOT), Vol. 9, No. 4, May - June 2008, http://www.jot.fm/issues/issue_2008_05/article2/index.html [Sun05] Sun Microsystems: 'Java Platform Debugger Architecture'. http://java.sun.com/javase/6/docs/technotes/guides/jpda/architecture.html, 2005 Availability informationThe Delta language IDE named Sparrow can be downloaded from (installer for Windows platform): http://www.ics.forth.gr/hci/files/plang/sparrow-setup.exe. It includes the Zen graphical debugger, the Disco command line debugger, and numerous examples, including a remake of the classical Snake game entirely in Delta. About the authors
Anthony Savidis, Yannis Lilis: "Support for language independent browsing of aggregate values by debugger backends", in Journal of Object Technology, vol. 8, no. 6, September-October 2009, pp. 159 - 180 http://www.jot.fm/issues/issue_2009_09/article4/ |
|||||||||||||

