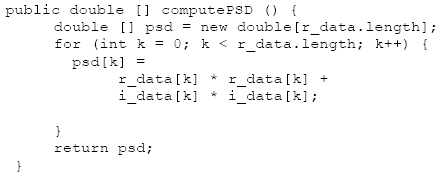
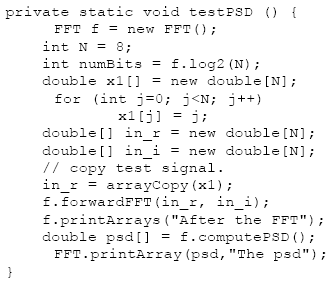
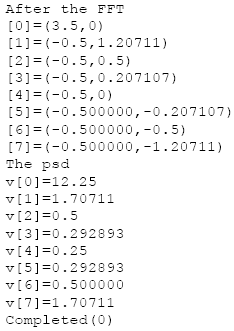
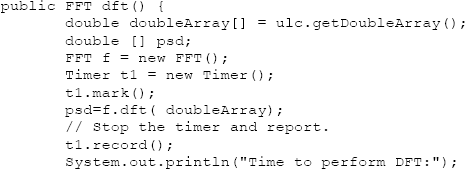
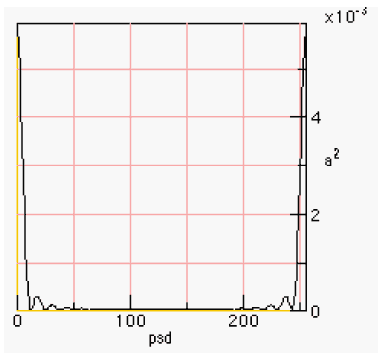
AbstractThis paper is part 3 in a series of papers about the Discrete Fourier Transform (DFT) and the Inverse Discrete Fourier Transform (IDFT). The focus of this paper is on computing the Power Spectral Density (PSD) of the FFT (Fast Fourier Transform) and the IFFT (Inverse Fast Fourier Transform). The implementation is based on a well-known algorithm, called the decimation in time Radix 2 FFT, and requires that its’ input data be an integral power of two in length. This paper demonstrates the computation of the PSD and applications of the DFT and IDFT. The applications include filtering, windowing, pitch shifting and the spectral analysis of re-sampling.1 INTRODUCTIONThis section introduces the DFT and PSD computations. We then demonstrate how to implement and display the numeric output, using Java. 1.1 The DFTGiven a sampled waveform The Continuous Time Fourier Transform (CTFT) is defined by: The DFT is given by: Direct computation of the DFT takes O(N2) complex multiplications while the FFT takes O(N log N) complex multiplications. The primary goal of the FFT is to speed computation of (1.3). Our last paper described an FFT algorithm known as the decimation-in-time radix-two FFT algorithm (also known as the Cooley-Tukey algorithm). 1.2 PSD ComputationsTo compute the PSD of the FFT output, we use the computePSD method in the FFT class. The PSD is computed by squaring the real and imaginary parts of the FFT output: The testPSD method demonstrates the use of computePSD: The output of the test method appears below: Figure 1.2-1 shows the PSD of a real input. Real-valued signals are always symmetric about the origin.
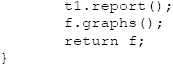
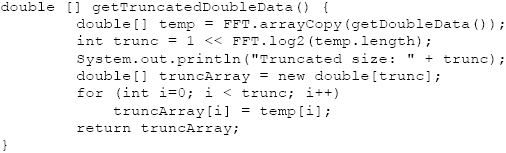
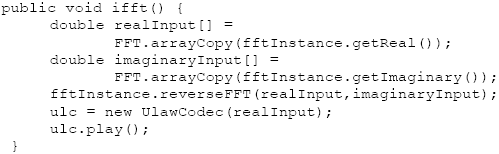
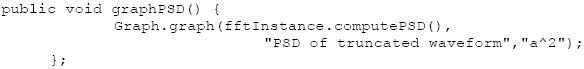
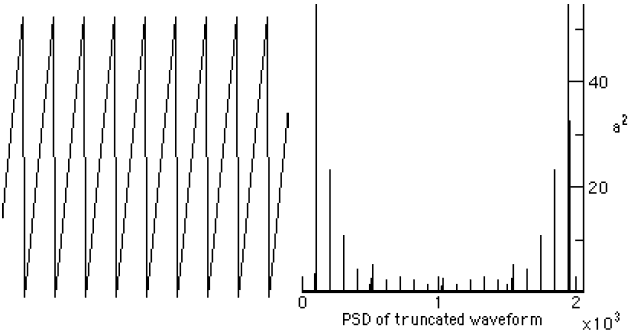
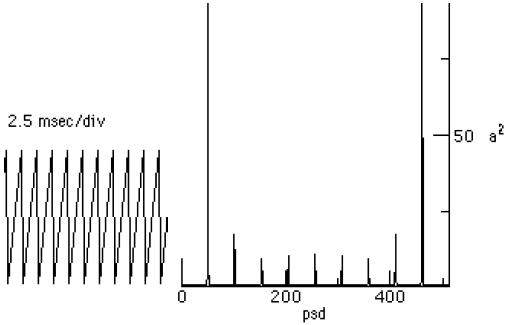
Figure 1.2-1. The PSD of a 2048 Sampled Waveform The implementation of the PSD computation and the graphing are shown in the following section. 1.3. Implementation of the Transforms in the AudioFrameIn the AudioFrame class, we assume that we will be taking the FFT of a real signal. A real signal, like audio, has no imaginary part, only a single value that varies from sample to sample. Thus, we construct a complex input to the FFT, setting the imaginary part of the input equal to zero. When taking the IFFT, a signal that starts as being real will end up as a real signal. The exception to this occurs when a spectral modification introduces terms that do not null out in the imaginary plane. Figure 1.3-1 shows the part of the Audio menu in the MainMenuBar in the AudioFrame that contains the transform fragments for performing the FFT manipulations. The keyboard shortcuts are shown in brackets (i.e., ‘[1]’). Figure 1.3-1. The Transform Fragment of the AudioFrame In the following DFT and IDFT code, we include facilities for benchmarking the execution of the DFT on long sequences. The IDFT method follows: In the following method getTruncatedDoubleData truncates the input data to the nearest integral power of two. The audio data is copied before truncation occurs. It is not overwritten until after the ifft method is invoked. The getTruncatedDoubleData truncation method follows: An FFT is part of an analysis phase, while the IFFT is part of a synthesis phase. The ifft method throws away the imaginary part of the reverseFFT methods output. For real input signals, the imaginary part is zero, in theory. We have found, however, that there is some small near-zero imaginary part that has been attributed to round-off error. The graph of the PSD is drawn using graphPSD A saw wave and its’ PSD are shown using the OscopeFrame and graph methods on the left and right in Figure 1.3-2.
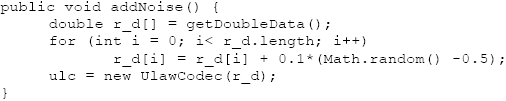
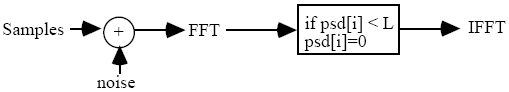
Figure 1.3-2. Saw Wave and Spectral output from the graphPSD method. 2 A NOISE FILTER USING THE FFTThe basic idea of providing a noise filter is that you take a signal, with added noise, perform an FFT on the signal, remove all spectral harmonics that have a PSD below some threshold, and then take the IFFT. Selecting the PSD threshold for noise can be tricky. What works well on a synthetic sound might turn a sampled sound into silence. A block diagram of the process appears in Figure 2-1. The code for adding noise to the waveform stored in the AudioFrame instance is shown below:
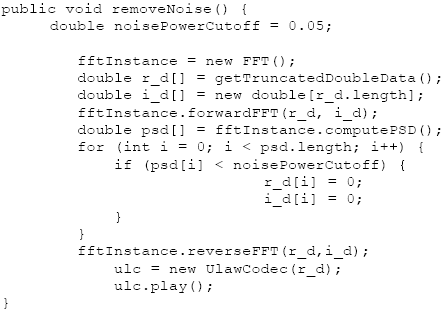
Figure 2-1. The Noise Filter The Math.random method returns a random value between zero and one. Thus, the sampled data is summed with time-domain uniformly distributed noise (also known as white noise). The following code performs a PSD-based cutoff, after taking the FFT of the sound samples: The UlawCodec is described in [Lyon 08G]. The initial waveform is a sine wave of 400 Hz. A graph of the sine wave with PSD is shown in Figure 2-2.
Figure 2-2. Graph of the Sine Wave at 400 Hz with PSD Figure 2-3 shows the sine wave after noise is added.
Figure 2-3. Sine wave after the addition of noise The PSD of the sine wave plus noise is shown in Figure 2-4.
Figure 2-4. The PSD of the Sine Wave plus Noise Figure 2-5 shows the clean spectral break between the noise and the sine wave. The removal of noise from such a waveform is performed with a trivial frequency-based amplitude detector.
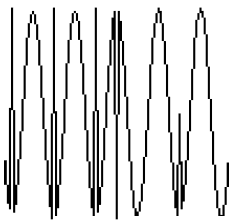
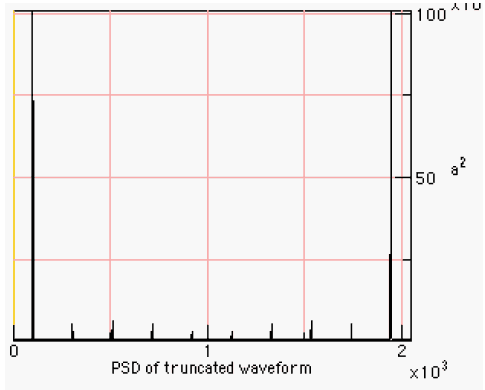
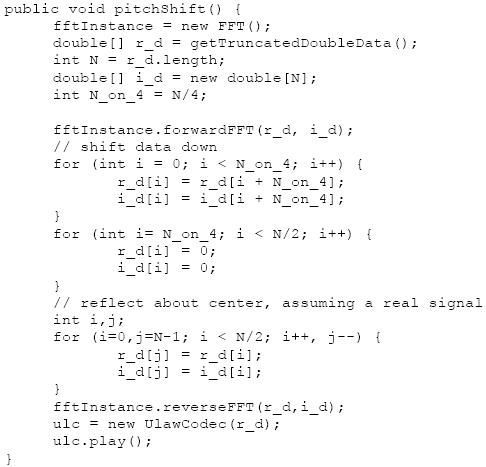
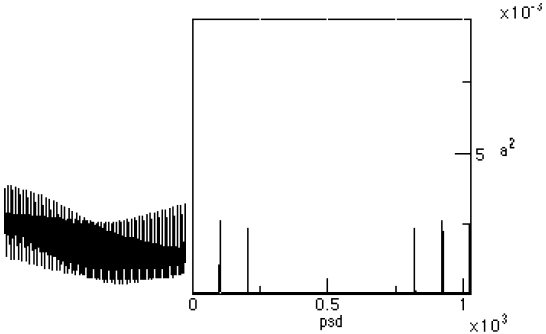
Figure 2-5. The Reconstructed Waveform and its psd 3 FREQUENCY SHIFTING USING THE FFTTo shift the pitch of a time-domain signal, we take the FFT, perform the high-pass filtering, shown in the previous section, shift the spectrum lower, and then perform the IFFT. Recall that the FFT produces a real and a complex output. The pitch shifter as just one of many possible spectral modifications that may be performed by the user before the IFFT is taken. The approach is to work on bins 0..N/2 first, then to copy the bins about the N/2 point in the spectrum, assuming that the left and right-hand sides are symmetric (as is always the case for real signals). The code for the pitch shift follows: The result for synthetic tones, rich in harmonics, is to filter out some of the lower frequencies and to lower the upper harmonic content.
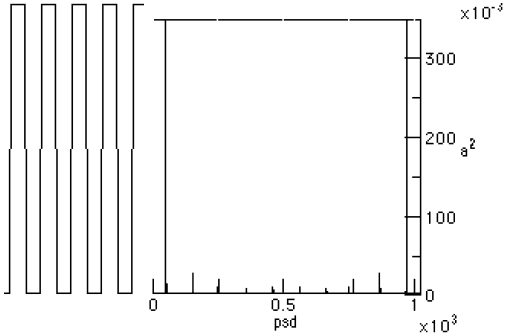
Figure 3-1. The Squarewave and its psd
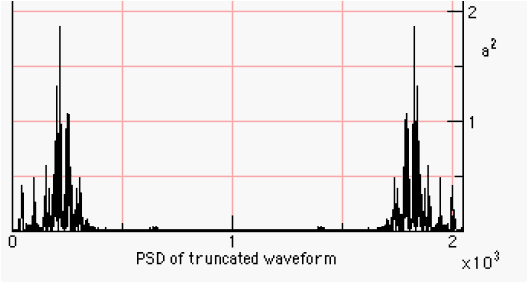
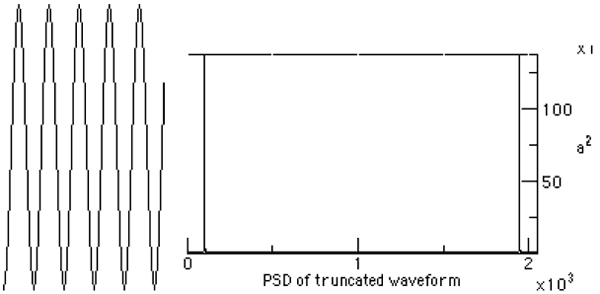
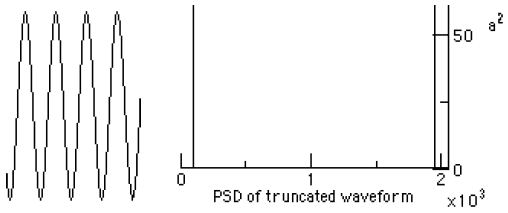
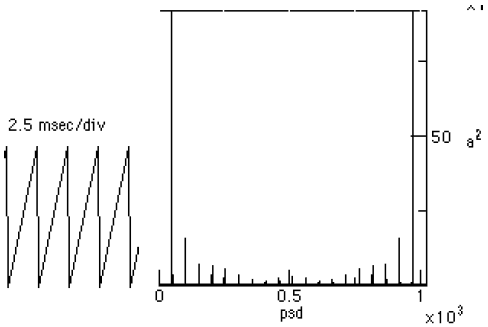
Figure 3-2. The pitch-shifted square wave and its psd. 4 RESAMPLING AND THE FFTResampling a 1D waveform is a common way to perform time-compressed speech. One way to perform the resampling is to perform Fairbanks sampling and throw away every other sample [Fairbanks]. Figure 4-1 shows a saw wave and its PSD.
Figure 4-1. The sawwave and psd before the subsampling
Figure 4-2. The Saw Wave and PSD after Sub Sampling From figures 4-1 and 4-2 we can clearly see that the 2:1 sub sampling has doubled the pitch of the harmonics, and halved the number of available samples. 5 CENTERING THE FFTTypically the lowest frequency is located at the center of the PSD when taking an FFT. This is due to the process of centering the FFT (called centering). Centering the FFT is accomplished by replacing the sample data with a value that is changing from positive to negative when the sample value goes from zero to one. This described by:
for the real sample on input. After the IFFT (or IDFT) the formula must be applied again [Myler].
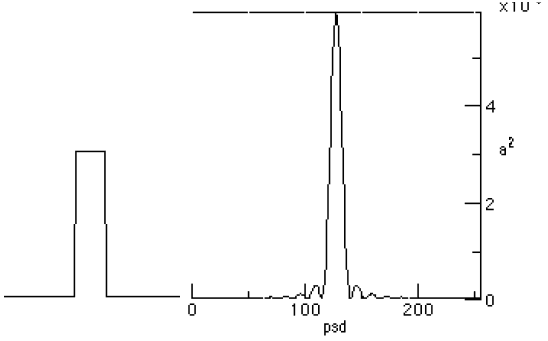
Figure 5-1 A Pulse with A Centered psd. The centered PSD for a pulse is shown in Figure 5-1. One can modify the forwardFFT in using: Where centering is a method that equation (5.1) for the real part of the sample data. The reverseFFT implements centering after the IFFT is finishing up:
Figure 5-2. An Un-Centered PSD Without centering the PSD is shown with the lowest frequencies on the edges. This is the convention that we have adopted for the 1D PSD display (except when explicitly marked otherwise). Left un-centered, the FFT and DFT produce results that can match the outputs of other FFT and DFT implementations (like [Moore]). As a result, we felt it best to leave the spectrum un-centered, at least for the 1-D FFT. 6 SUMMARYThe idea that a pitch shifter be combined with a re-sampler to compress speech is not new. In fact, it may be used to help perform skimming on recorded speech (a topic of current research) [Arons]. The introduction to the DFT, IDFT, FFT and IFFT is not new either. Also, it is probably the case that the FFT is not the fastest. For the fastest Fourier transform in the west, see http://theory.lcs.mit.edu/~fftw. It may well be the fastest, but it may also rank as one of the most complex of implementations. It is still O(N log N) but it has a very low constant time. This link also has pointers to public domain software for performing FFTs (including a mixed radix FFT). REFERENCES[Arons] 1997. “SpeechSkimmer: A System for Interactively Skimming Recorded Speech”, by Barry Arons. ACM Transactions on Computer-Human Interaction 4:1, pps. 3-38. Also on http://barons.www.media.mit.edu/People/barons. [Fairbanks] 1954. “Method for Time or Frequency Compression-Expansion of Speech”, Transactions of the Institute of Radio Engineers, Professional Group on Audio AU-2: 7-12. [Lyon 90] “Ad-Hoc and Derived Parking Curves”, by Douglas Lyon, SPIE - International Society for Optical Engineering, Boston MA, November 8, 1990. [Lyon 97] Java Digital Signal Processing, Douglas A. Lyon and H. Rao, M&T Press (an imprint of Henry Holt). November 1997 [Lyon 08G] "The U-Law CODEC",by Douglas A. Lyon, Journal of Object Technology, vol. 7, no. 8, November-December 2008, pp. 17-31, http://www.jot.fm/issues/issue_2008_11/column2/ [Moore] 1990. pps. 560, Elements of Computer Music, Moore, F.R., Prentice Hall, Englewood Cliffs, NJ. [Myler] 1993. pps. 284, Computer Imaging Recipes in C, Harley R. Myler and Arthur R. Weeks, Prentice Hall, Englewood Cliffs, NJ. Floppy. About the author
Douglas A. Lyon: "The Discrete Fourier Transform, Part 3: The PSD", in Journal of Object Technology, vol. 8. no. 6, September-October 2009 pp. 17-30 http://www.jot.fm/issues/issue_2009_09/column2/ |
||||||||||
 (1.2).
  (1.3).