AbstractThis paper describes how use the HTMLEditorKit to perform web data mining on stock statistics for listed firms. Our focus is on making use of the web to get information about companies, using their stock symbols and YAHOO finance. We show how to map a stock ticker symbol into a company name gather statistics and derive new information. Our example shows how we extract the number of shares outstanding, total volume over a given time period and compute the turnover for the shares. The methodology is based on using a parser-call-back facility to build up a data structure. Screen scraping is a popular means of data entry, but the unstructured nature of HTML pages makes this a challenge.1 THE PROBLEMPublicly traded companies have statistical data that is typically available on the web (using a browser to format the HTML data). Given an HTML data source, we would like to find a way to create an underlying data structure that is type-safe and well formulated. We are motivated to study these problems for a variety of reasons. Firstly, for the purpose of conducting empirical studies, entering the data into the computer by hand is both error-prone and tedious. We seek a means to get this data, using free data feeds, so that we can perform data mining functions. Secondly, we find that easy to parse data enables us to teach our students the basic concepts of data mining. This example is used in a first course in network programming. 2 FINDING THE DATAFinding the data on-line and free is a necessary first step toward this type of data mining. We obtain stock statistics by constructing a URL from the ticker symbol. The ticker symbol has a format that is exchange dependent. For example, NASDAQ (National Association of Securities Dealers Automated Quotations system) uses a four-character ticker symbol. In comparison, NYSE (New York Stock Exchange) uses a maximum of 3 characters in a ticker symbol. To obtain an HTML rendering of the key statistics for a company, try: http://finance.yahoo.com/q/ks?s=schw This is shown in Figure 1-1.
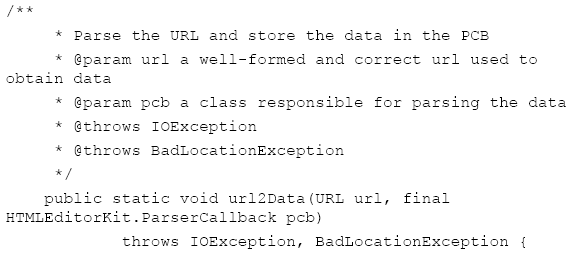
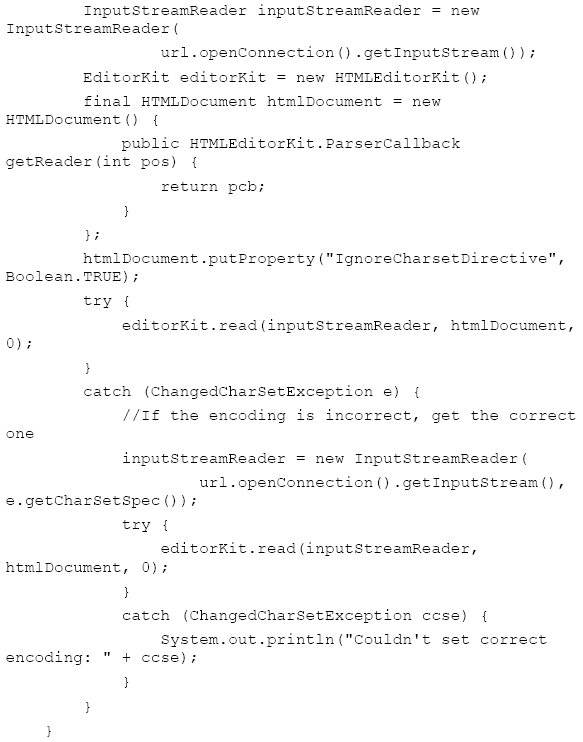
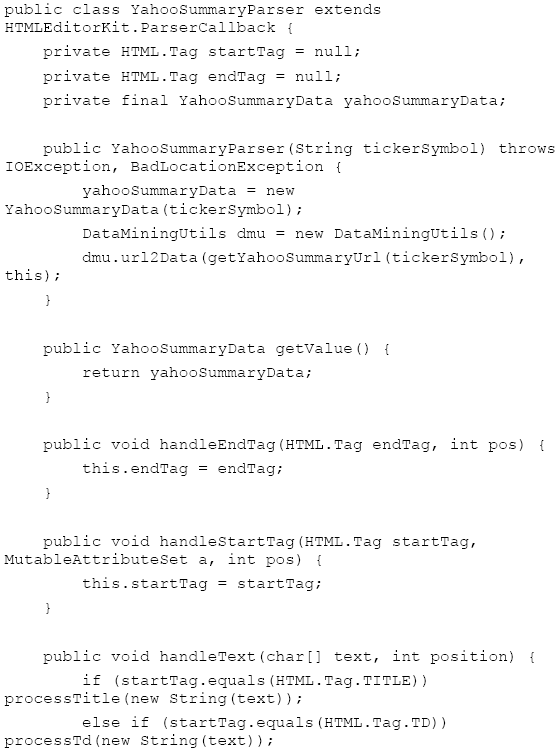
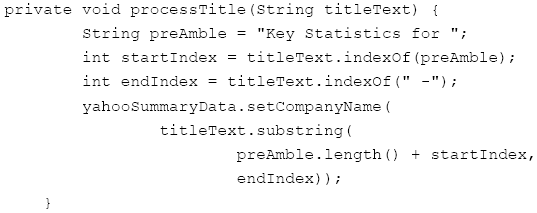
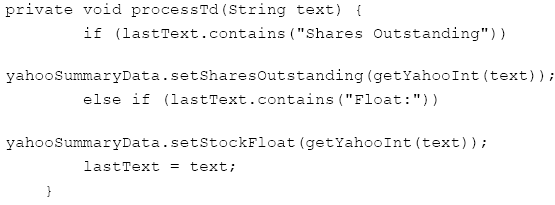
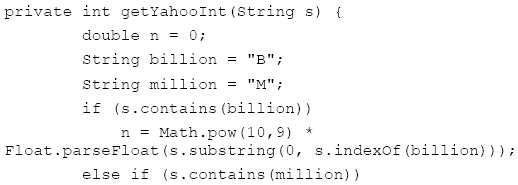
Figure 1-1. Yahoo Key Statistics One of the first things to notice is the page title. Wouldn't it be nice if we could make use of the data, contained by the title and map the ticker symbol into a company name? The URL is decoded as: To synthesize the URL needed to get the data, we use: 3 ANALYSISIn order to process HTML-based data we need to decide how we are going to store and parse the data. To parse the data, we make use of the HTMLEditorKit as a means to allow HTML tags to invoke callback methods: The url2data method is a means, given a ParserCallBack class, to process any correct URL. This is a general and compelling method for performing HTML driven data processing. Central to the proper function of the url2data method is the idea that the ParserCallBack is not only responsible for processing HTML tags, but it is responsible for building up a strongly-typed data structure that can be queried. This data structure is not serialized, due to its dynamic nature. Further, many ParserCallBack instances may exist in the system, one for every ticker symbol. The ParserCallBack not only must handle HTML tags, but the data that follows them. For example, when we query finance.yahoo.com for the symbol mgam we see that the title tag appears to contain the name of the company. As the title tag occurs once, and only once, in the well-formed HTML document, we use our encounter with the tag to indicate to our parser that the following text contains the title. We start with a ticker symbol and seek to store the statistics into a simple class: Setters and getters are already in the YahooSummaryData. A publicly traded firm has shares that are outstanding. To compute the number of shares outstanding, add all issued shares and subtract off any treasury stock. After the company computes the number of shares outstanding, it files a report with the SEC. Thus, the number of shares outstanding, obtained from YAHOO, is sourced from the latest annual or quarterly report to the SEC. Treasury stock is held in the treasury of the issuing company. It reduces the number of outstanding shares in the open market. When an issuing company engages in a stock repurchase, the treasury stock is not sold. The stock float is the number of shares outstanding less the number of shares held by insiders, favored parties and employees. The shares in the float are restricted in terms of ownership and when and how they can be sold. Float is computed by subtracting the restricted shares from the number of shares outstanding. During a stock repurchase, if insiders promise not to tender their shares, we can use the float to compute the total number of shares that might be tendered. The float is reported with an SEC filing, just like the number of shares outstanding. When stock is issued to insiders, it increases the number of shares outstanding, but not the float. As the insiders proceed to sell their shares into the open market, the float increases. The role of the YahooSummaryParser is to download the HTML data and fill the YahooSummaryData. We consider it important to separate the data store facility from the parsing mechanism, as the parsing could be implemented using any of several possible techniques. Further, by overriding the toString method, we can transform the data into a reasonable CSV representation of the underlying data. Thus, the goal is to make use of a simple API: In order to output: Recall that (from Figure 1-1), schw has 1.25B shares outstanding with 1.01B shares in the float. In order to implement the parser, we need to know what the previous HTML tag is, and that is stored in our startTag and endTag variables: We are interested in HTML data of the form: Thus, we know when we are inside of the title tag, by virtue of our startTag variable, and we need only provide for a little ad-hoc string processing to identify the company name: Since there is only one title tag in a document, this kind of parsing is relatively easy. The next section describes how to handle multiple instances of table data tags in a document. 4 CONTEXT-DRIVEN TABLE DATAIn the previous section, we showed that a tag that appears only once (i.e., the title tag) was pretty low-hanging fruit. However, there are some tags that appear multiple times, such as the table data tag td. These are unique, not for their attributes but for the label text that they contain. For example, table data that contains the labels "Shares Outstanding" or "Float:" have special significance. These labels appear in tables right before the data associated with them, thus we write: This technique enables us to identify data encoded into a table of the form "unique label string" followed by "a consistent data string". This allows us to make use of the technique for a whole class of table data on the web. As far as the consistent data string assumption goes, numbers take the form "nn.nnB" and "nn.nnM" (standing for billion and million). Our parser makes use of ad-hoc string manipulation, for handling numbers that are in the YAHOO table data. Perhaps there is a more general way to do this type of parsing, but such a technique has, so far, been elusive. The existing technique is sensitive to changes in table data label strings and numeric representation strings. 5 IMPLEMENTING A STOCK VOLUME CHARTWe are interested in a new "killer application" for development, called the JAddressBook program. This program is able to chart historic stock volumes (and manage an address book, dial the phone, print labels, do data-mining, etc.). The program can be run (as a web start application) from: http://show.docjava.com/book/cgij/code/jnlp/addbk.JAddressBook.Main.jnlp
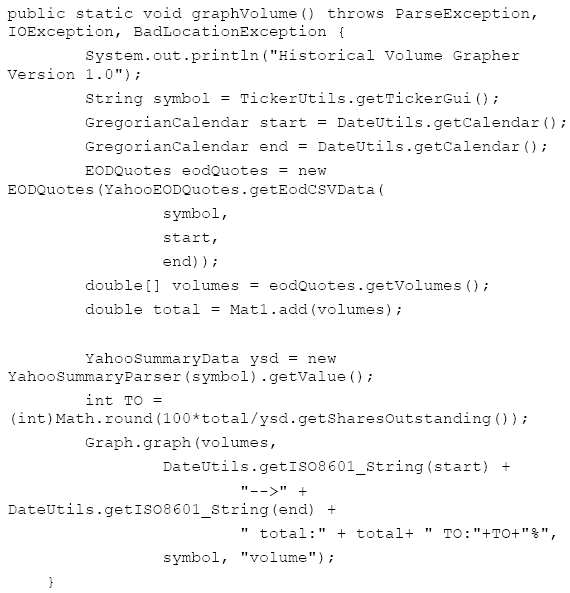
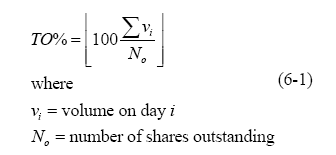
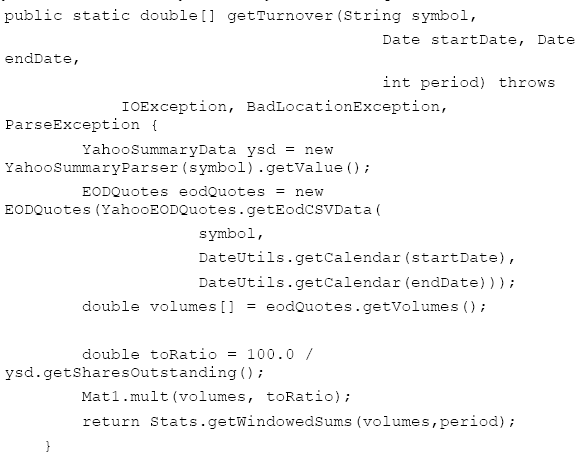
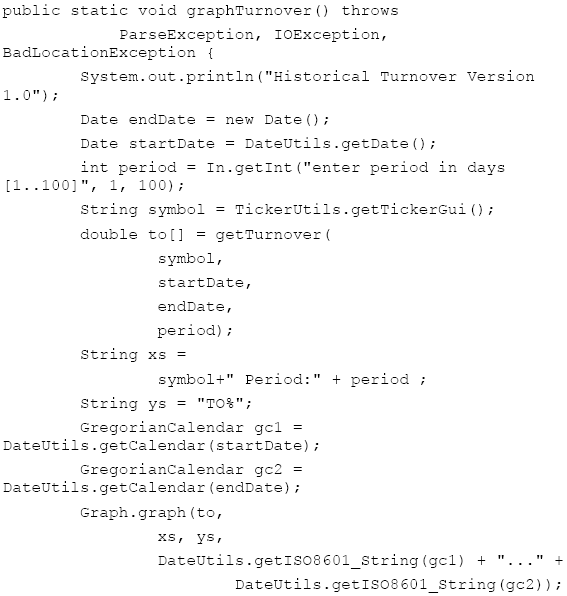
Figure 5-1. The Volume Chart Figure 5-1 shows an image of the volume chart for MGAM. The mining of CSV data is not new, however, our use of it for graphing stock volume and computing turnover (TO) in Java may be [ Lyon 04D]. Turnover is expressed as a percentage of the total number of shares that have changed hands divided by the total number of shares outstanding. MGAM intends to repurchase 8% of its outstanding shares on 7/10/07, yet 17% of the stock changed hands between 6/9/2007 and 7/9/2007. The question of how this impacts the repurchase activity is a topic of current research. The stock volume chart is created using a graphing framework that makes use of the façade design pattern to simplify the interface: Having a programmatic means of computing turnover may help a shareholder to decide how much relative activity there has been in a stock. For example, MGAM had 17% turnover in the 30-day period preceding their repurchase activity. This is actually a little low, as turnover for the months of March and April was 25% and 24%. 6 SLIDING WINDOW TURNOVER COMPUTATIONSThis section describes how to compute turnover between two different dates using a window. Typically, we are inclined to move the window by the length of the window. Thus, if we have a 2 day window and a 50 day sample, we should move the window 25 times (if there is no overlap) and by a 2 day increment. This type of sample is, however, not necessarily correct in that it may introduce sampling artifacts. Thus, we suggest the use of a sliding window. In order to normalize the volume so that we can understand it relative to the total number of shares outstand, we use the turnover (TO): The TO is computed using a sliding window, over a given period of days. The volume used is the historical end-of-day volume. In order to provide a sliding window of turnover data, we need to establish the window size (in days) the window overlap (in percent) and the number of windows to be computed. For example, with a 50% overlap in a window of 30 days, a 12 window analysis would cover 0-30 days, 15-45 days, etc. For example: Where: And: We graph the turnover using: Figure 6-1 shows the turnover for MGAM, with a 2 day period for the 30 days preceding the termination of its Dutch auction repurchase activity,
Figure 6-1. Turnover with a 2 day Window 7 CONCLUSIONIn this paper we disclosed techniques that make use of the HTMLEditorKit and ad-hoc parsing to extract numeric, context-sensitive table data, from the web. This technique presents some reusable code, along with a plug-in style callback-parsing framework that is sensitive to changes in URL protocol and presentation data. A new metric of trading volume, the turnover, was created using a GUI and a semi-automatic data mining technique that combined CSV-based historic stock volume and the summary stock statistics. The question of how turnover impacts repurchase operations remains open. Also open is the question of how to extract data that is not tabular with table data prefixes. Relaxation of this assumption is a logical next step. REFERENCES[Lyon 04D] Java for Programmers, by Douglas A. Lyon, Prentice Hall, Englewood Cliffs, NJ, 2004. About the author
Cite this column as follows: Douglas A. Lyon "The Stock Statistics Parser", in Journal of Object Technology, vol. 7. no. 6, July-August 2008 pp. 17-23 ttp://www.jot.fm/issues/issue_2008_07/column2/ |
|||||


